安装Prometheus
创建prometheus用户
1
| useradd -M -s /usr/sbin/nologin prometheus
|
下载二进制文件压缩包
1
| wget https://github.com/prometheus/prometheus/releases/download/v2.45.4/prometheus-2.45.4.linux-amd64.tar.gz
|
解压安装包内容至/opt/prometheus/prometheus
1
2
| tar -xvf ./prometheus-2.45.4.linux-amd64.tar.gz -C /opt/prometheus
mv /opt/prometheus/prometheus-2.45.4.linux-amd64 /opt/prometheus/prometheus
|
更改/opt/prometheus以及其内容的属主和属组
1
| chown prometheus:prometheus -R /opt/prometheus
|
创建prometheus服务
创建文件
1
| vim /etc/systemd/system/prometheus.service
|
插入如下内容后保存退出
1
2
3
4
5
6
7
8
9
10
11
12
13
14
15
16
17
18
19
| [Unit]
Description=Prometheus Service
Documentation=https://prometheus.io/docs/introduction/overview/
After=network-online.target
[Service]
Type=simple
User=prometheus
Group=prometheus
Restart=on-failure
ExecStart=/opt/prometheus/prometheus/prometheus \
--config.file="/opt/prometheus/prometheus/prometheus.yml" \
--storage.tsdb.path="/opt/prometheus/prometheus/data" \
--storage.tsdb.retention.time="60d" \
--web.enable-lifecycle
[Install]
WantedBy=multi-user.target
|
启动服务
1
| systemctl start prometheus
|
安装alertmanager
下载二进制文件压缩包
1
| wget https://github.com/prometheus/alertmanager/releases/download/v0.27.0/alertmanager-0.27.0.linux-amd64.tar.gz
|
解压安装包内容至/opt/prometheus/alertmanager
1
2
| tar -xvf ./alertmanager-0.27.0.linux-amd64.tar.gz -C /opt/prometheus
mv /opt/prometheus/alertmanager-0.27.0.linux-amd64 /opt/prometheus/alertmanager
|
更改/opt/prometheus以及其内容的属主和属组
1
| chown prometheus:prometheus -R /opt/prometheus
|
创建prometheus服务
创建文件
1
| vim /etc/systemd/system/alertmanager.service
|
插入如下内容后保存退出
1
2
3
4
5
6
7
8
9
10
11
12
13
14
| [Unit]
Description=Alert Manager
Wants=network-online.target
After=network-online.target
[Service]
Type=simple
User=prometheus
Group=prometheus
ExecStart=/opt/prometheus/alertmanager/alertmanager --config.file=/opt/prometheus/alertmanager/alertmanager.yml --storage.path=/opt/prometheus/alertmanager/data
Restart=always
[Install]
WantedBy=multi-user.target
|
启动服务
1
| systemctl start alertmanager
|
整合alertmanager和prometheus
修改prometheus配置
打开prometheus配置文件
1
| vim /opt/prometheus/prometheus/prometheus.yml
|
加入如下内容
1
2
3
4
5
6
7
8
9
10
| alerting:
alertmanagers:
- static_configs:
- targets:
# 根据实际填写alertmanager的地址
- localhost:9093
rule_files:
# 根据实际名修改文件名
- "alert.yml"
|
增加触发器配置文件
新建文件
1
| vim /opt/prometheus/prometheus/alert.yml
|
添加内容
1
2
3
4
5
6
7
8
9
10
11
12
| groups:
- name: Prometheus alert
rules:
# 对任何实例超过30s无法联系的情况发出警报
- alert: 服务告警
expr: up == 0
for: 30s
labels:
severity: critical
annotations:
instance: "{{ $labels.instance }}"
description: "{{ $labels.job }} 服务已关闭"
|
检查配置文件
1
| /opt/prometheus/prometheus/promtool check config /opt/prometheus/prometheus/prometheus.yml
|
重启服务
1
| systemctl restart prometheus
|
安装Grafana
1
2
3
| sudo apt-get install -y adduser libfontconfig1 musl
wget https://dl.grafana.com/enterprise/release/grafana-enterprise_10.4.1_amd64.deb
sudo dpkg -i grafana-enterprise_10.4.1_amd64.deb
|
安装node_exporter
下载二进制文件压缩包
1
| wget https://github.com/prometheus/node_exporter/releases/download/v1.7.0/node_exporter-1.7.0.linux-amd64.tar.gz
|
解压安装包内容至/opt/prometheus/node_exporter
1
2
| tar -xvf ./node_exporter-1.7.0.linux-amd64.tar.gz -C /opt/prometheus
mv /opt/prometheus/node_exporter-1.7.0.linux-amd64 /opt/prometheus/node_exporter
|
更改/opt/prometheus以及其内容的属主和属组
1
| chown prometheus:prometheus -R /opt/prometheus
|
创建node_exporter服务
创建文件
1
| vim /etc/systemd/system/node_exporter.service
|
插入如下内容后保存退出
1
2
3
4
5
6
7
8
9
10
11
12
13
| [Unit]
Description=node_exporter
Documentation=https://prometheus.io/
After=network.target
[Service]
User=prometheus
Group=prometheus
ExecStart=/opt/prometheus/node_exporter/node_exporter
Restart=on-failure
[Install]
WantedBy=multi-user.target
|
启动服务
1
| systemctl start node_exporter
|
配置prometheus自动拉取node_exporter数据
打开prometheus配置文件
1
| vim /opt/prometheus/prometheus/prometheus.yml
|
追加内容
1
2
3
4
5
6
| - job_name: 'node-exporter'
scrape_interval: 15s
static_configs:
- targets: ['localhost:9100']
labels:
instance: node-exporter服务器01
|
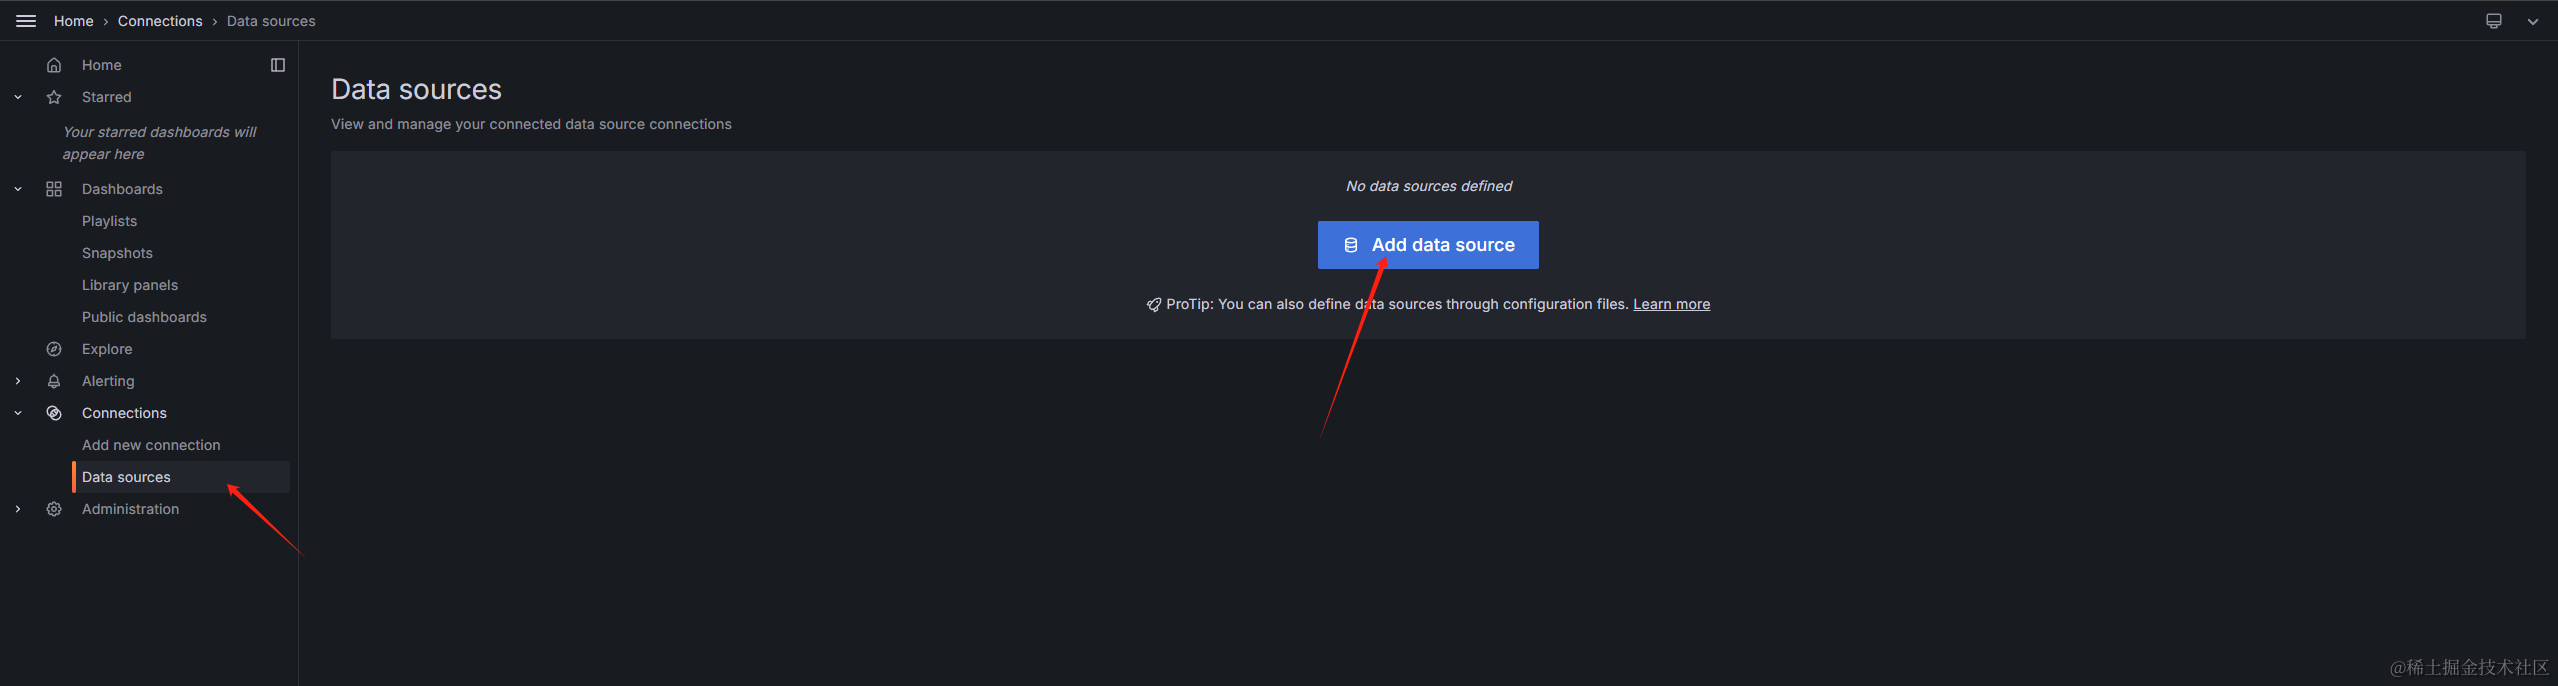
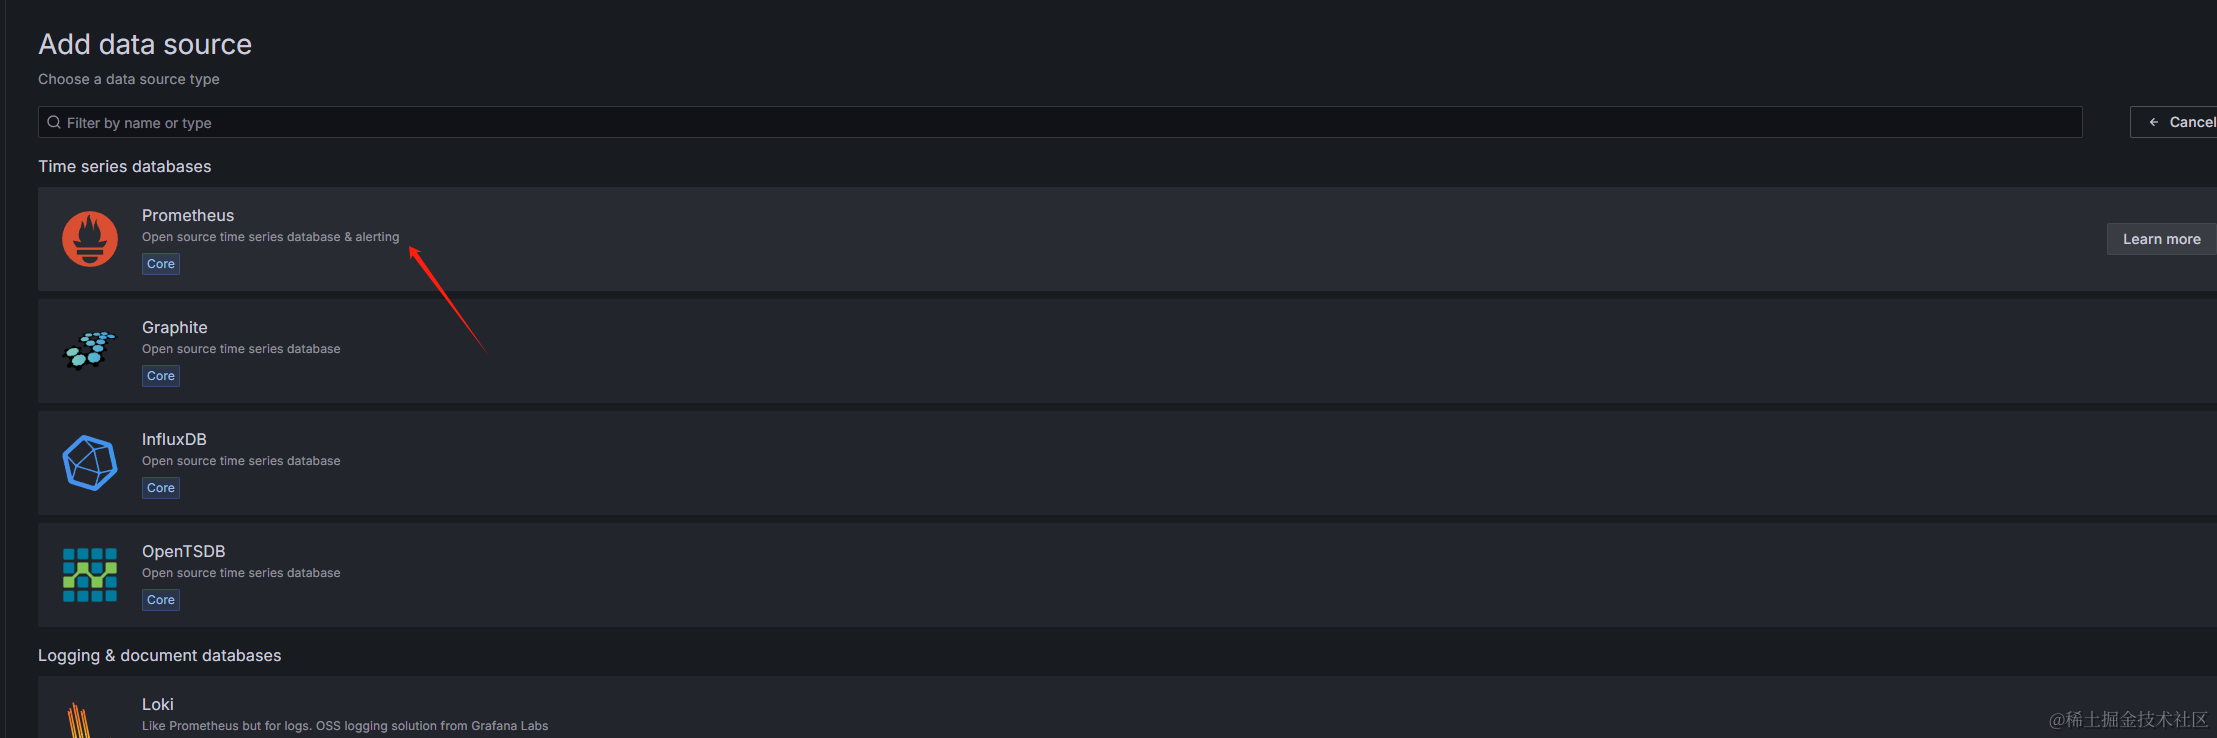
grafana添加prometheus数据源
进入grafana的web图形界面,登录
默认账号:admin,
默认密码:admin
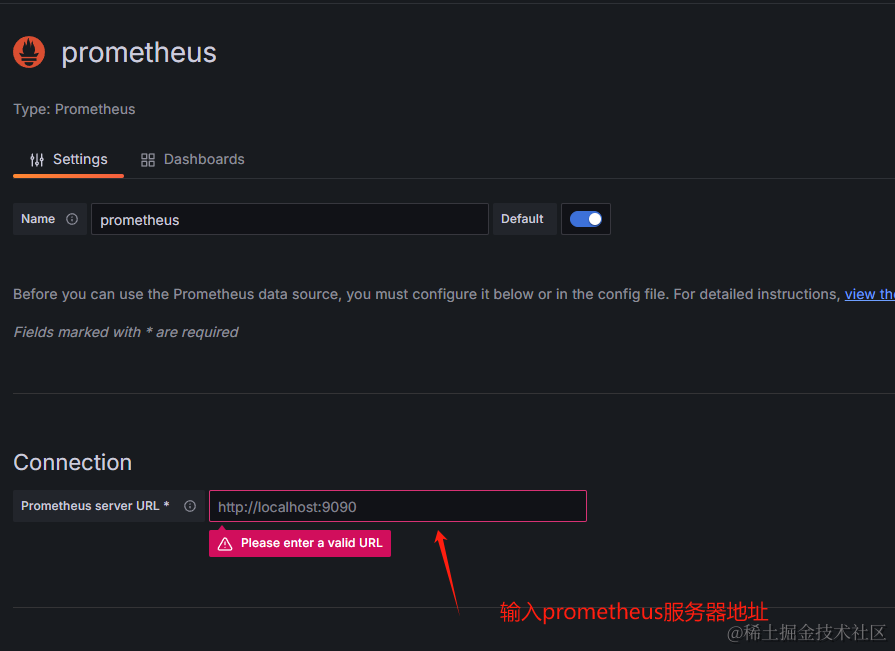
保存即可
grafana添加node_exporter仪表盘
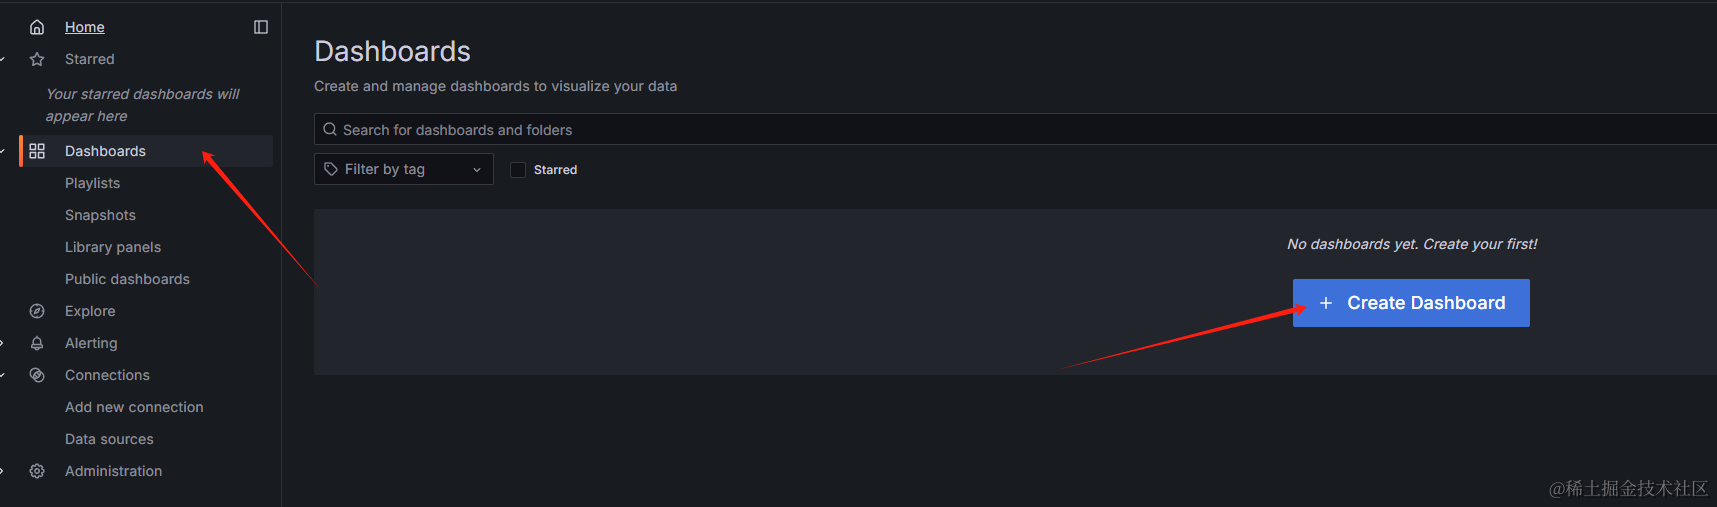
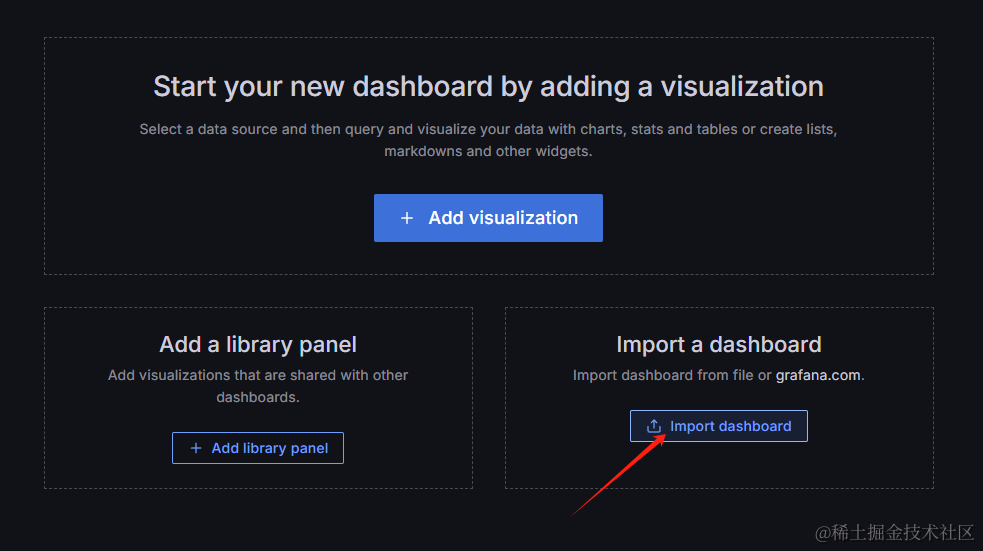
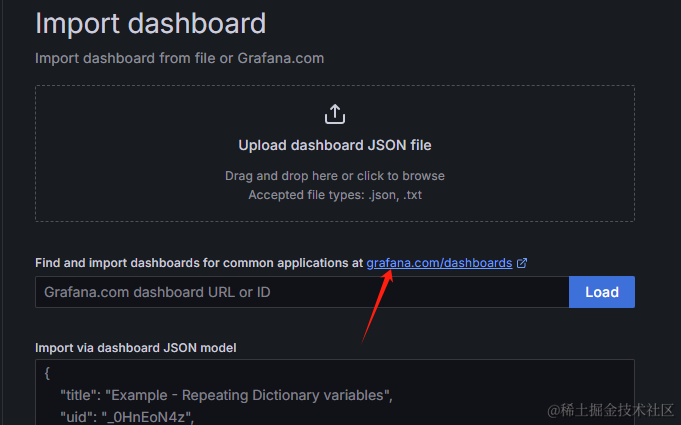
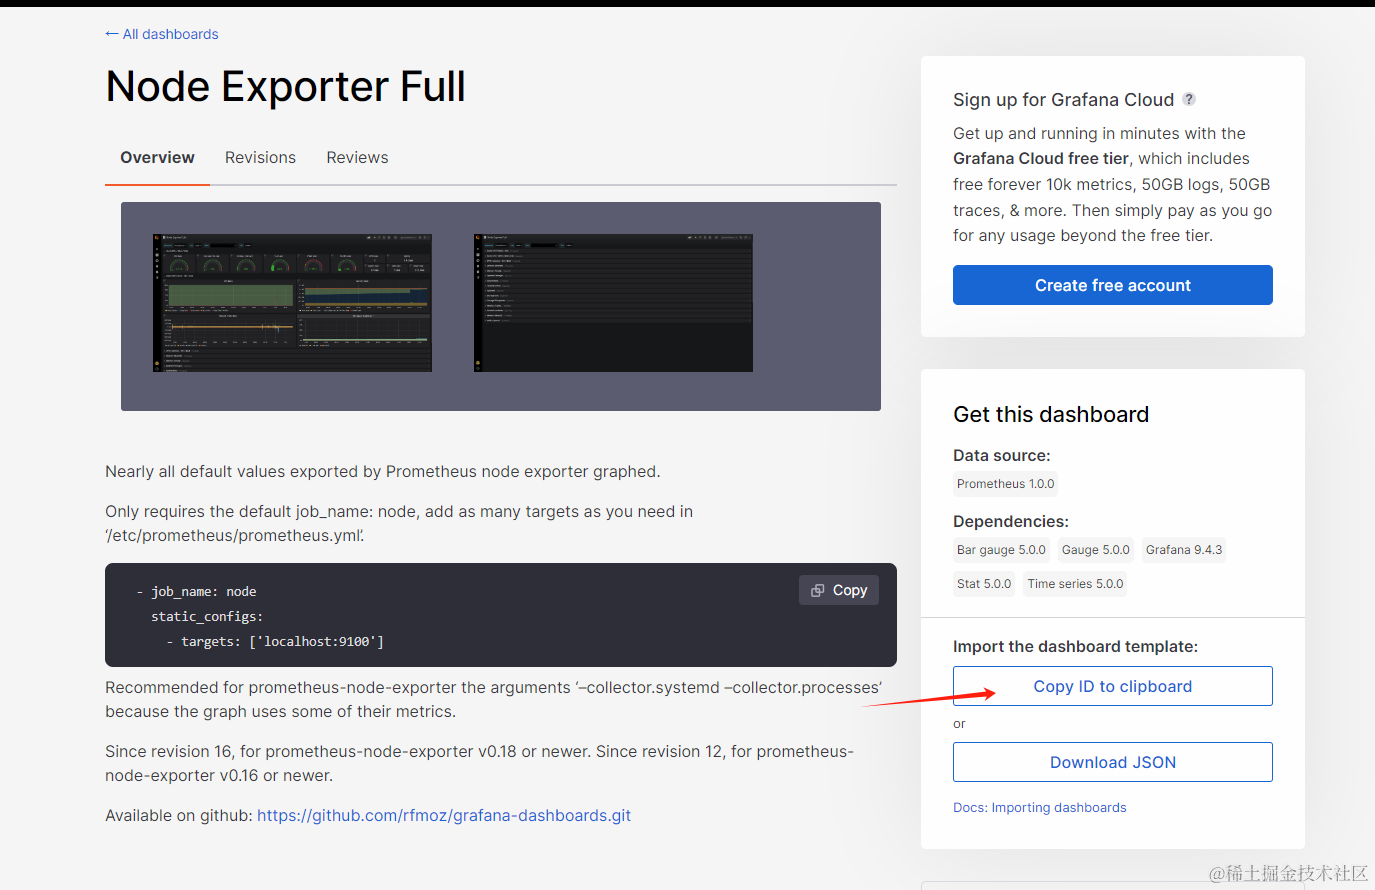
在新页面中,找到node_exporter,进入详情页,点击按钮复制ID
返回grafana,在输入框中粘贴,然后点击Load按钮
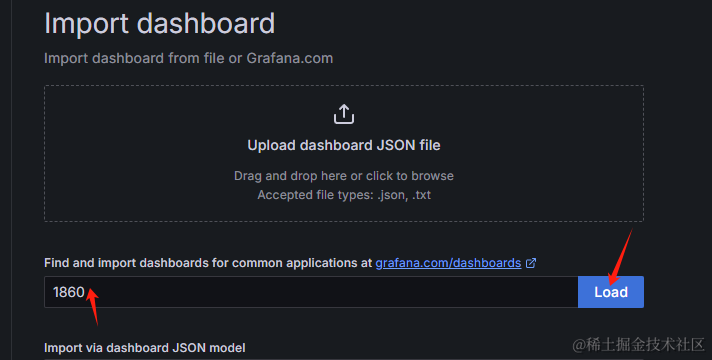
Name可自行修改,然后数据源选择刚刚创建的prometheus
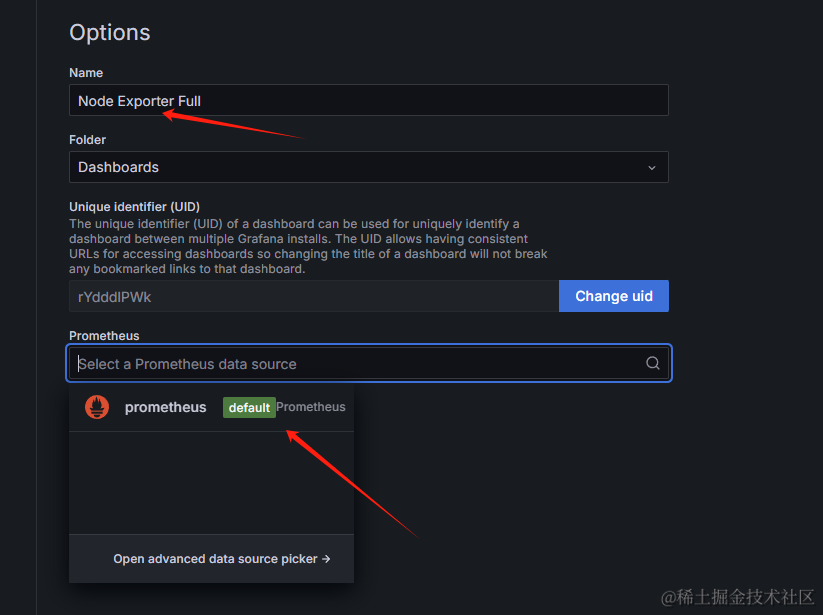
最后点击Import即可
